Articles
The AFP FP&A Momentum Index: Results from Q3
- By Bryan Lapidus, FPAC
- Published: 9/9/2021
Results:
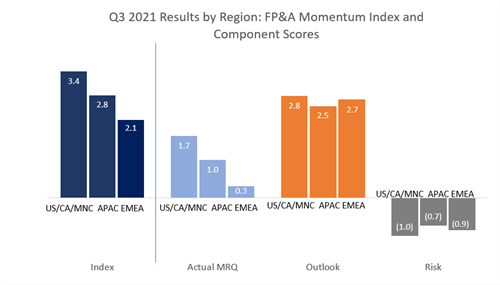
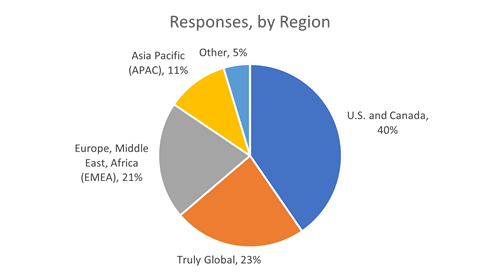
Responses for Q3 2021 included sufficient numbers to calculate an Index level for three global regions. The US/CA/MNC had the highest reading at 3.4, with results from the most recent quarter (MRQ) significantly higher than other regions at 1.7. All three regions have an optimistic Outlook, increasing from the MRQ, with a notable turnaround in EMEA. Risks are considered highest in US/CA/MNC, (1.0). There were 201 global responses.
Commentary:
- The Momentum Index is an economic outlook as articulated by a curated data compilation from FP&A for Corporate Finance data.
- The scores and outlook mirror the prospects for managing COVID 19: the higher US/CA/MNC index is similar to other market indices that indicate that the US/CA/MNC is in a stronger position for positive GDP expansion compared to other regions of the world.
FP&A Momentum Index: Trend Report
Results:
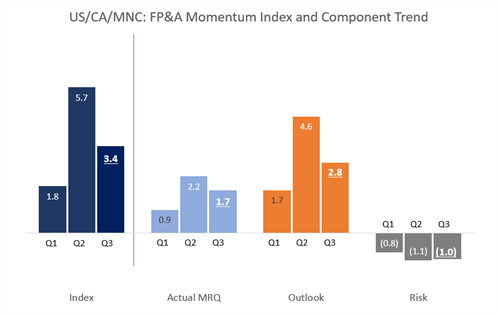
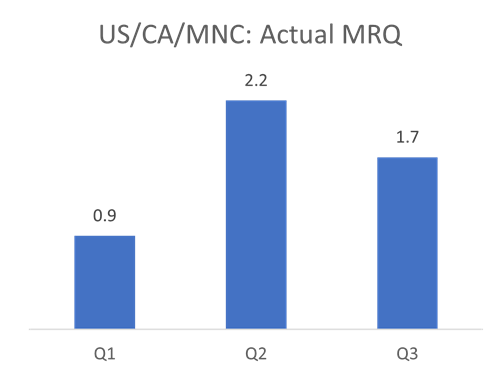
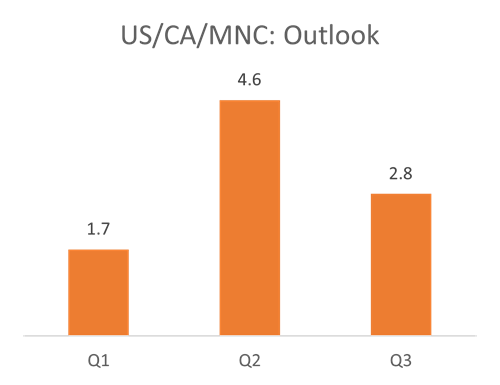
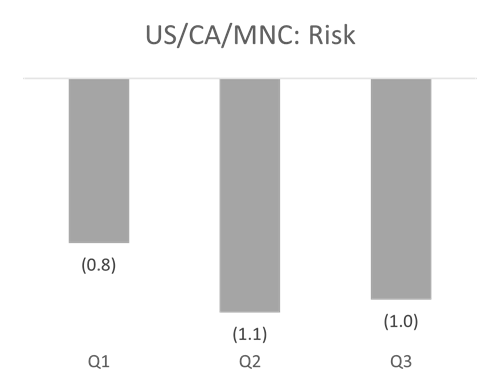
AFP has sufficient data over three quarters to examine a trend in the US/CA/MNC. The enthusiastic increase from Q1 to Q2 was tempered in Q3 as the overall index fell to 3.4. This falling score represents the decrease in MRQ results, from 2.2 to 1.7, and a decrease in the Outlook from 4.6 to 2.8. The Risk view changed slightly, hovering at (1.0). There were 128 responses from US/CA/MNC.
Commentary:
Covid 19 is still driving the business climate. The sequential quarterly decline is likely an indicator of the spread of the Delta variant and its role on the economy moving into Q3.
The Quarter That Was: Drivers of the Actual MRQ Component
Results:
AFP has sufficient data over three quarters to examine a trend in the US/CA/MNC. The Actual MRQ for this region was positive, but lower than Q2. The revenue was comparable, but there were slight decreases in business activity: development of new products, new markets and M&A/JV activities. Sales, advertising and marketing spend decreased and non-cash working capital increased. Travel and Entertainment expenses remain the largest drag, even though they improved slightly.
Commentary:
- Continued T&E spending constraints serve as a significant headwind to actual MRQ
- Interesting increase in internal investment back to neutral, partially offset by slowing momentum of new products, markets and acquisitions. Are the ‘develop and grow’ elements losing steam?
Looking Ahead: Drivers of the Outlook Component
Results:
AFP has sufficient data over three quarters to examine a trend in the US/CA/MNC. For this region, the optimism from Q1 to Q2 was tempered in Q3 as this component fell from 4.6 to 2.8. The pessimism was across the board in nearly every area. Revenue and earnings expected to decline, and companies are looking to pull back spending in sales and marketing, business investment, T&E expense, and expansive business opportunities.
Commentary:
- All growth and spending elements retreated quarter-over-quarter.
- The anticipated big ‘economic explosion’ coming from pent up demand and massive cash stockpiles looks muted at best.
- New virus variants combined with supply chain friction and labor shortages (skillsets) may be holding back the expansion.
Challenges Ahead: Drivers of the Risk Component
Results:
The overall risk score mitigated slightly moving from Q2 to Q3, settling at (1.0). In fact, the scores improved in five of the six areas. Financial risk was the outlier that increase. Among the improving scores, the biggest change was in human capital; however in absolute terms, that remains the highest scoring risk.
Commentary:
- Human Capital is surprising with a slight improvement (it remains the number one risk cited). The civilian labor force participation rate remains virtually unchanged and the unemployment rate is decreasing, perhaps new hiring strategies are starting to pay off in labor intensive services sector?
- Cyberrisk improved, likely because the Q2 survey was conducted during several high-profile hacks and ransom attacks. This may be base level.
State of Play in FP&A: Global Techniques in Modeling and Analysis
Results:
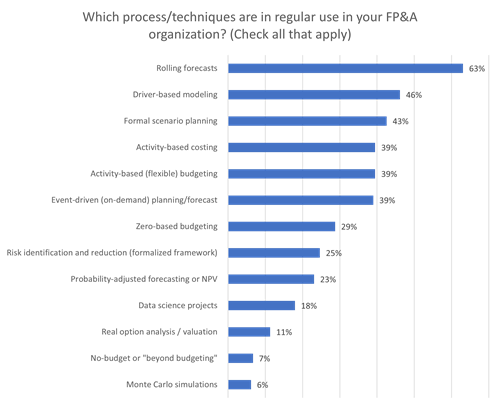
- A series of techniques are rapidly acquiring critical mass usage: Driver-based modeling 46%, Scenario Planning 42%, Activity-based costing and similarly Activity-based budgeting at 39%, and Event-driven planning at 39% as well.
- Government/Non-profit entities were most likely to use various techniques listed, although they accounted for 11% of respondents. They were followed by publicly traded companies, Private/PE companies, and finally Private/Non-PE.
Commentary:
- Enterprises are focusing on process changes enabled by flexible technology. The top five techniques include elements of increased data and application of that data. No longer are budgets compiled with raw numbers, but real operational and economic drivers are explored and become part of the technique.
- By comparison, three of the bottom five were more mathematically sophisticated techniques.
- Globally, rolling forecasts are now standard in 63% of organizations. Interestingly, Privately held (non-PE) companies were least likely to use this technique.
- Zero-based budgeting produced the most polarizing results. Nearly half of Government/Non-profit entities and 38% of Privately held PE firms use ZBB, but only 24% of Public firms and 13% of Privately held Non-PE firms do!
Recap of the AFP FP&A Momentum Index
The AFP Momentum Index survey was developed by members of the AFP FP&A Advisory Council, finance practitioners representing various industries and companies. It is administered by the Research Department of AFP, and the data is from a survey of independent FP&A practitioners. The Index has a single composite score based on three individual sub-scores that will be tracked over time. The sub-scores are as follows:
- Actual Most Recent Quarter (MRQ): how did your ACTUAL RESULTS compare to the most recent forecast? Data is gathered on 10 elements.
- Outlook: how has your company's OUTLOOK changed for the subsequent six months? Data is gathered on the same 10 elements.
- Risk: what is your company's RISK OUTLOOK for the next six months? Data is gathered across six risk categories.
AFP has launched the Momentum Index, a quarterly survey designed to take the pulse of the business community as seen from the point of view of the FP&A department. The survey was developed by members of the AFP FP&A Advisory Council.
Reading the results: This is a momentum survey, where the resulting number indicates the direction relative to past readings. A positive or increasing composite number indicates business growth; a negative or declining number indicates a diminished economic performance.
Copyright © 2024 Association for Financial Professionals, Inc.
All rights reserved.

